This article explains the application of Deep Learning on physical oceanography. Please see LICENSE about this article and source code. If you have any questions, please contact LotFun on Twitter.
Overview
Vertical structure in the ocean are related to sea surface features (Ex. height, temperature, chlorophyll, etc). This trial attempts to estimate the vertical structure (temperature and salinity) from sea surface features by Deep Learning. We adapt our proposed method to the region of the North Pacific Subtropical Gyre since sea surface and internal structures vary by location.
We use Argo profile and sea surface height, temperature and chlorophyll. Spatial resolution of sea surface data is 0.25 degree x 0.25 degree and it is not enough to resolve submeso-scale (~10km) phenomenon. Therefore our proposed method aims to estimate the difference in the order of meso-scale (~100km). Although this dataset can not resolve submeso-scale impact, shallow layers are more sensitive to the influence of submeso-scale dynamics. To take this into account and estimate shallow layer profile more correctly, we use sea surface chlorophyll since it is expected to be relatively influenced by the submeso-scale dynamics.
Our proposed method has two contributions: first, our method estimates internal structure with only sea surface data. Our approach may enable us to obtain more internal structure data with higher frequency and spatial density than can be obtained with the current Argo program. On the other hand, since this method requires a large amount of Argo profiles, our study argues the importance of the Argo program and the need for further development. Second, we show the importance of the application of machine learning on the oceanography. In recent years, although we can get more dataset in the ocean, they are limited in temporal and spatial resolution. To monitor the state of the ocean, satellite observations can provide a wide range of high-frequency data, however they are limited to the sea surface and insufficient to understand the entire ocean. In our study, we will try to link sea surface data by satellite with data of the interior of the ocean. Our method indicates the potential to obtain more frequent and dense data in the interior of the ocean, and we hope to gain a more detailed understanding of the ocean.
Dataset
We use following datasets:
- Sea Surface Temperature, Height and Chlorophyll
- Download from Copernicus Marine Environment Monitoring Service (CMEMS)
- Spatial resolution : 0.25 x 0.25 degrees
- Time resolution : Daily
- Data aggregation:
- Crop sea surface data to a specified square size. (Ex. 4 x 4 degree)
- Find the closest Argo profile to the center of the cropped data and use it as the vertical profile corresponding to the cropped data.
- Argo profile
- North Pacific Argo Float Data Set published by OKA Eitarou
- We interpolate profile data by Akima spline
- Other information
- Location (latitude and longitude)
- State of the ocean is strongly related to the location. For example, low temperature in high latitudes, high temperature in low latitudes.
- Temporal (seasonal) information (__NOT EXPLICITLY IMPLEMENTED__)
- Since the oceans have seasonal variability, it is impossible to determine whether the differences are temporal or spatial without taking into account temporal information.
- Since the combination of latitude, longitude and sea surface data is considered to indirectly contain temporal information, we do not explicitly implemented it.
Training information
Our method is supervised training of:
- Input : Cropped sea surface temperature, height and chlorophyll map data
- Ground truth : Corresponding vertical profile
Configurations:
- Common information
- Latitude : 10 – 40
- Longitude : 140 – 220
- Period (Train and Validation):
- Begin : 2018-01-01
- End : 2019-12-31
- Period (Test):
- Begin : 2020-01-01
- End : 2021-01-17
- Train-Validation split
- Train : Validation = 0.75 : 0.25
- Shuffle before splitting
- Sea surface data
- Height, temperature and chlorophyll
- Crop resolution : 4 x 4 degrees
- Argo prifile
- Minimum pressure: 10 dbar
- Maximum pressure: 1000 dbar
- Interpolation interval: 10 dbar
Brief results
Estimated results (profiles)
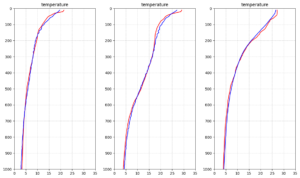
In this section, we compare profiles of ground truth and estimated.
- Ground truth : Red line
- Estimated : Blue line
Better cases
Following results are better estimations. We show typical patterns: relatively little change in the vertical direction (Left), significant changing in the intermediate layer (Center) and significant overall changing (Right).
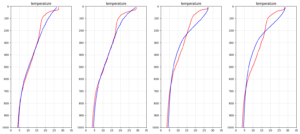
Bad cases
The two graphs on the left can not estimate the changes in the shallow layers. On the other hand, the two graphs on the right can not estimate well to relatively deep layers.
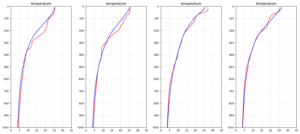
We show slightly different difficulties. Although the above four graphs indicated incorrect estimations, following results show the difficulties of small scale dynamics. The two graphs on the left can not estimate small scale changes in the layer shallower than 400 dbar. Two graphs on the right shows smaller scale changes in the layer above 200 dbar.
As mentioned in the overview section, the spatial resolution of satellite data is 0.25 x 0.25 degrees, and since our target is to correctly estimate meso-scale variability, estimating such small scale variability is considered difficult by current satellite data.
Estimation examples
Sea surface height
SSH on 2020/10/01 the estimation was performed.
Black lines denote the locations of estimated vertical sections.
- Zonal sections:
1. Latitude: 32, Longitude: 140-150
2. Latitude: 38, Longitude: 150-160 - Meridional sections:
1. Longitude: 144, Latitude: 30-40
2. Longitude: 154, Latitude: 30-40

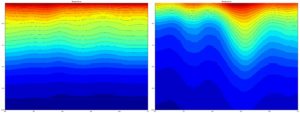
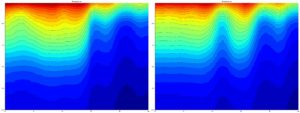
Zonal sections
- [Left] Latitude: 32, Longitude: 140-150
- [Right] Latitude: 38, Longitude: 150-160
Meridional sections
- [Left] Longitude: 144, Latitude: 30-40
- [Right] Longitude: 154, Latitude: 30-40
Conclusion
Our proposed method with Machine Learning (Deep Learning) indicated the potential to estimate internal structures of the ocean in the meso-scale resolution by using only satellite data. Since this deep learning model is relatively simple (fully convolutional backbone and some full connection layers), the direct implementation of physical phenomena into the model is expected to improve the accuracy of the estimation. We treated physical parameters and chlorophyll in the same way, but biogeochemical parameters such as chlorophyll are relatively strongly influenced by smaller scale phenomena. Therefore, building a model that can handle these parameters well will also allow us to estimate the internal structure more accurately.